the 3-ish week bug
i've been writing an operating system called zestos. it is based on mit's xv6 and written in zig for the riscv64 architecture.
3 weeks ago, a bug came up during the kernel's memory initialization phase, stemming from an oversight in extending the size of kernel stacks for each process. in zestos, there are 64 processes, each with a kernel stack occupying two pages:
- a guard page: blocked to trigger a storage fault (stack overflow) on any writes.
- the actual data page: grows downward by convention until it hits the guard page.
for the machine to locate these pages, they must be mapped from physical memory into virtual memory. if this sounds confusing, let's break down the key components involved.
processes
a process is an executing instance of a computer program. the kernel's primary function is to manage processes, creating the illusion that each is the sole program on the machine. while this analogy isn't entirely accurate, it effectively conveys the kernel's purpose.
processes interact with the kernel through system calls (syscalls) and have individual memory spaces via virtual memory.
virtual memory
virtual memory is a management technique that abstracts available storage resources. it creates the illusion of contiguous address spaces despite the potential fragmentation or swapping of physical memory to disk.
page tables
virtual memory is managed using page tables, tiered tree structures that efficiently store data about physical-to-virtual page mappings. the kernel has a unique page table with a one-to-one mapping of physical memory, with some exceptions.
zestos uses 3-level page tables with a 4096-byte page size. each pointer contains three 9-bit indexes and a 12-bit page offset. beyond physical page mapping, page tables store permissions (readable, writable, executable - r, w, x) and a user-accessible flag allowing the kernel to write data that a process can't access.
kernel stacks
kernel stacks are memory areas where the kernel stores temporary data, function call information, and local variables when executing process-specific kernel code.
trampoline
a trampoline is a code segment at the top of a user process's memory space. when a process needs to switch into kernel mode (like during a system call or a hardware event), the kernel uses this trampoline to store the current process's register values and facilitate the transition into kernel space. it stores these values in another memory region, the process's trap frame.
think of it as a springboard that bounces the execution from user space into kernel space, hence the name "trampoline." this mechanism allows for a smooth and controlled transition between the two modes, ensuring that the process state is preserved and can be restored when returning to user mode.
in the following sections, i'll discuss how these components interacted to create the bug, the troubleshooting process, and the ultimate solution.
the bug
when the kernel initializes, it bootstraps the first process into thinking it's returning from a system call. this involves setting up the process's trap frame, with the program counter set to 0 (the first instruction) and other configurations that aren't crucial to this discussion.
this was the combination that i spent three weeks figuring out:
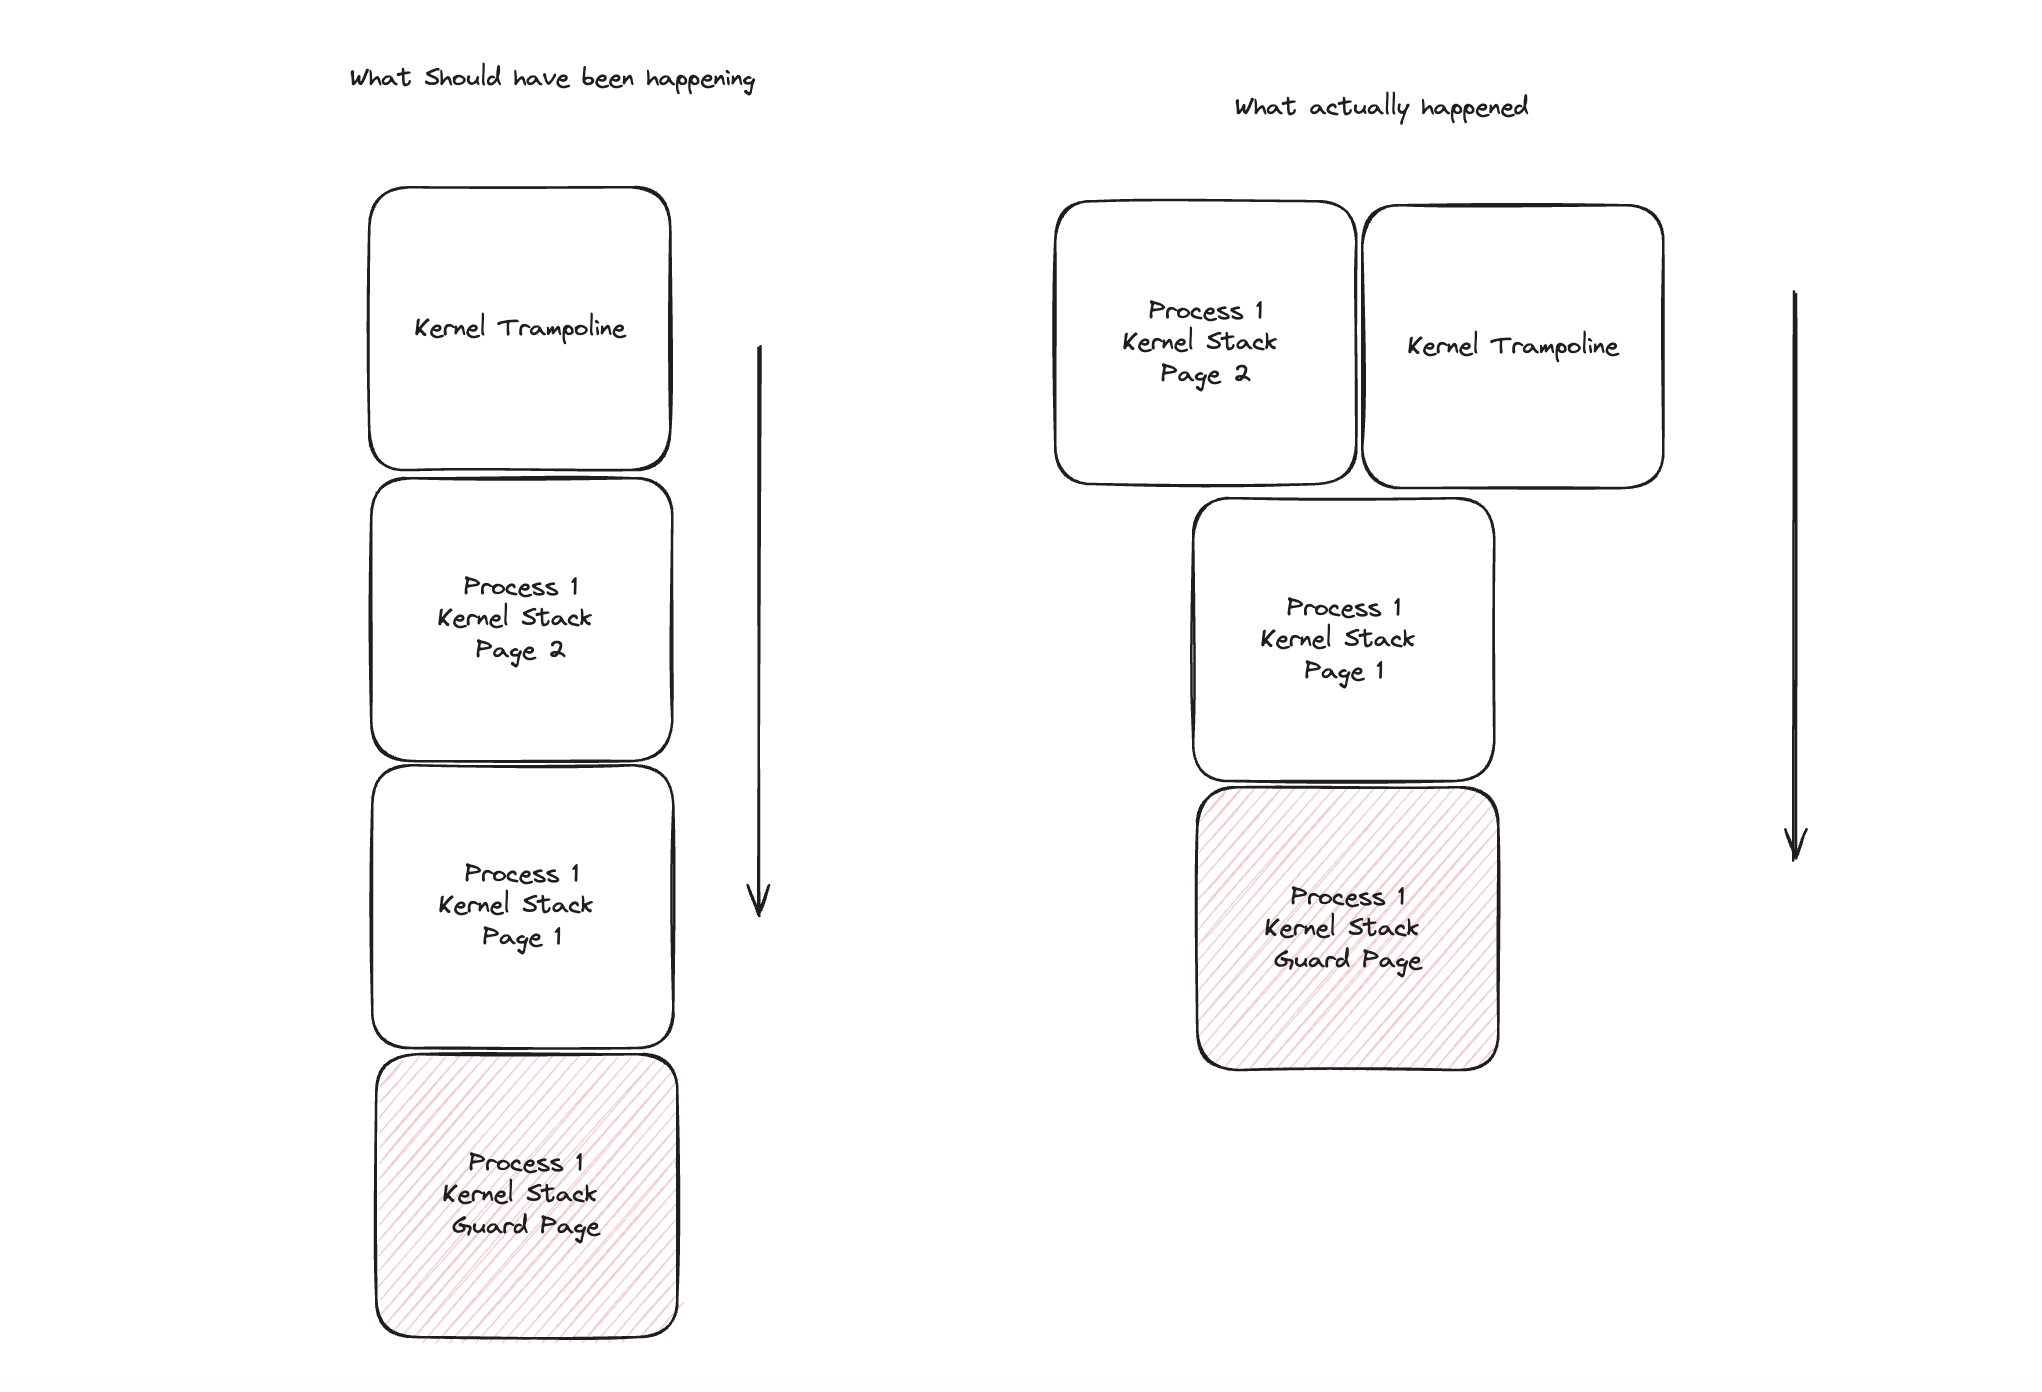
- kernel stacks had to be extended to 2 stack pages due to design decisions in the implementation.
- however, only one of the physical pages of the kernel stack was being mapped, while the second one wasn't.
- zestos' kernel page allocator gives out monotonically decreasing pages from the kernel's physical page limit.
- since this was the first process, the trampoline's page was mapped directly before the first kernel stack was mapped.
as a result, the trampoline's physical page was directly after the first stack page. the trampoline's page table entries were getting overwritten, which meant the process couldn't access the trampoline code. the end result? the kernel would freeze up and behave randomly.
the debugging journey
debugging this issue was a three-week odyssey, using gdb as my primary tool. while i love zig, writing zig compiled to freestanding targets has a caveat: you don't benefit from stack traces. this made the debugging process more challenging and time-consuming.
week 1: initial exploration
i started with gdb, repeatedly running the code and scrutinizing the output for anomalies. i wanted to decrease my kernel stack usage to keep it at one page, but this approach didn't pan out.
week 2: breakpoint analysis
in the second week, i shifted to tracking different behaviors through breakpoints. the main challenge was that the kernel would go dark at a certain point, cutting off gdb output. i started working backward from this "dark point" and isolated the forkreturn function as a critical area of interest.
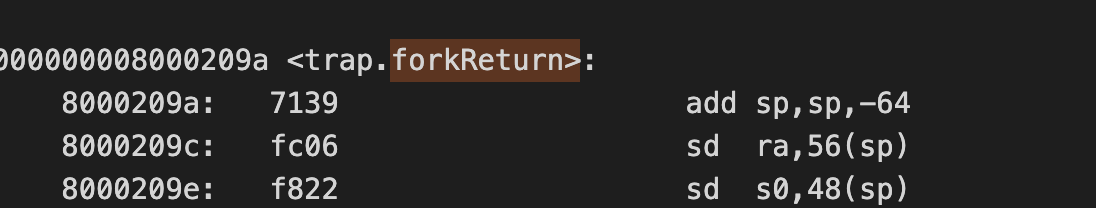
forkreturn is a function that serves as the entry point for every process (among other things). it's triggered from usertrapreturn, which returns to user space from kernel space by calling into the trampoline.
a crucial detail in my implementation is that my compiled code is not directly at the address that is called. since the trampoline is mapped into the last page of every process's (and the kernel's) memory region from inside the kernel binary, i needed to calculate the offset of the label i wanted to call and then add that offset to the address of the last page.

week 3: the breakthrough
i examined the kernel's page table for information about the trampoline address. comparing the trampoline's initial mapping with its value in usertrapreturn revealed a discrepancy. something was overwriting it.
this is where gdb's watchpoint feature came in handy. it allows you to monitor a section of memory for reads or writes. i set a watchpoint on the exact address corresponding to the kernel page table entry of the trampoline's page.
after tweaking with risc-v qemu and gdb, i pinpointed the instructions overwriting my page table value. it was a standard instruction at the start of each function, storing the old frame pointer and return address into the stack.
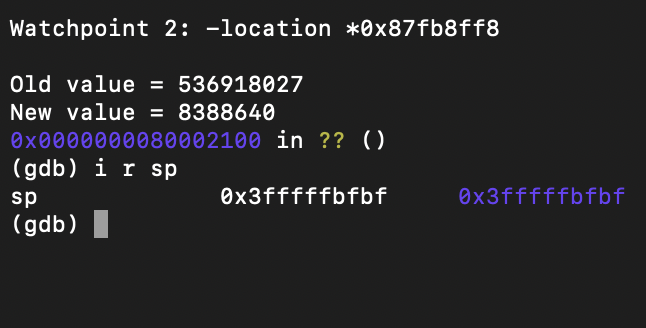
checking the stack value at that point revealed the root cause: it wasn't mapped correctly, and a page was double allocated. the solution became clear: i needed to allocate another page and map it to the kernel stacks' second page.
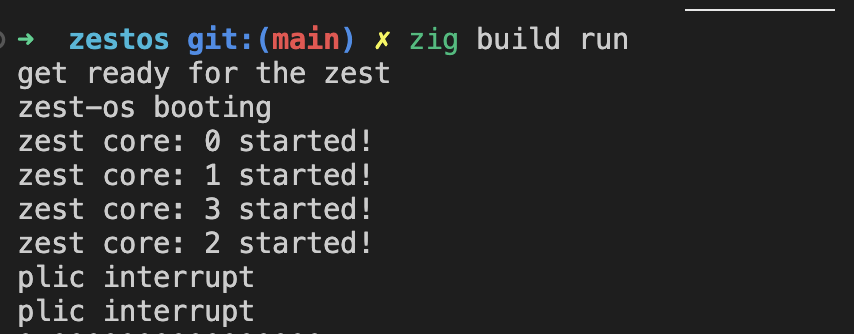
once i added this fix, the os began churning out logs as usual, and i experienced that euphoric moment every debugger lives for.